PEAKS
Morning and evening windows
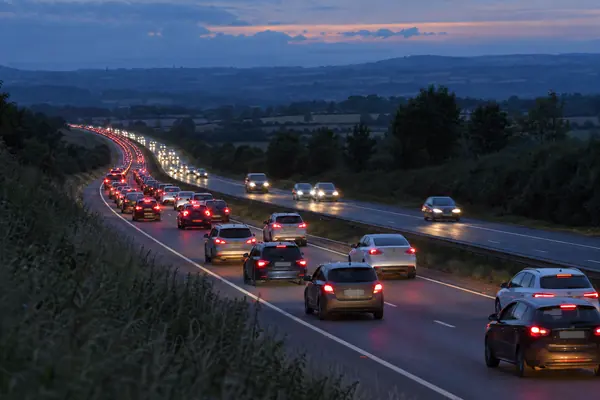
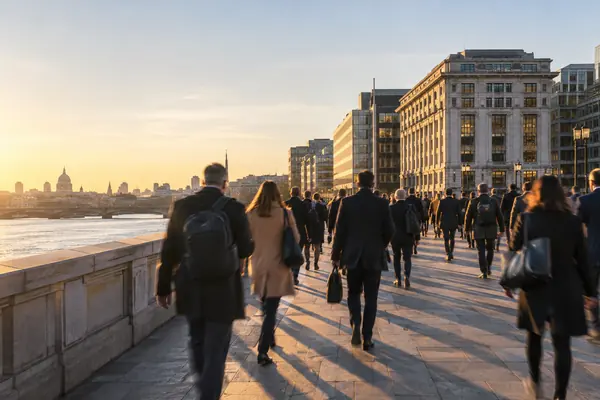
DfT data shows commuting is concentrated into a morning peak of 07:00 to 09:00 and an evening peak of 16:00 to 19:00.
Compare commutes doodlerush
WHAT THE TRAVEL DATA SAYS
Rush hour is built around the journey to work.
Compare commutes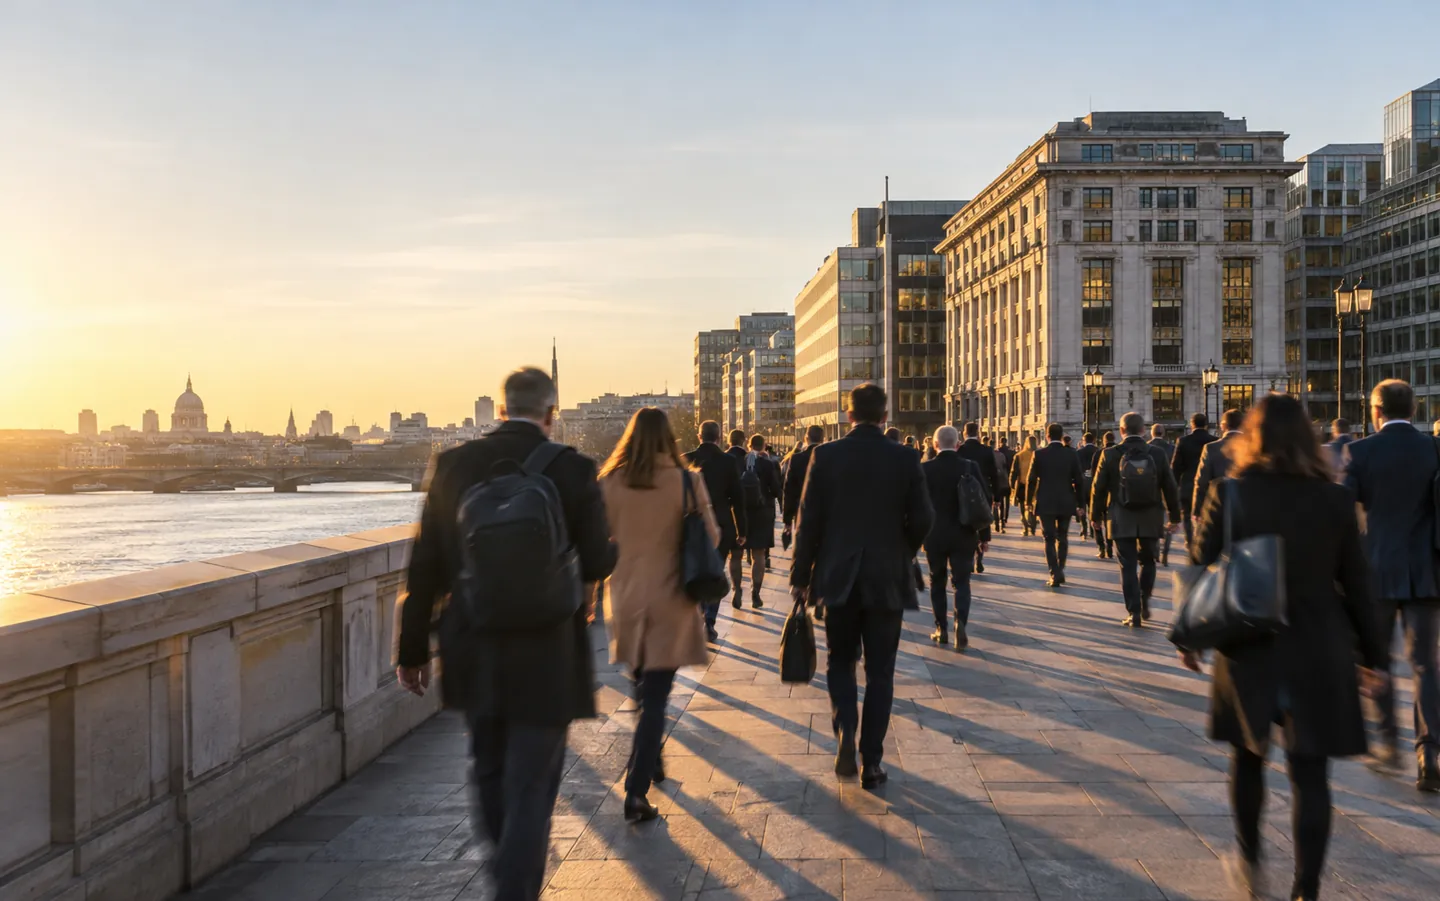
7–9AMthe morning peak
Commuting is only a small share of the trips people make, but it piles into two short windows each weekday. Department for Transport surveys show when, how and how much that is changing.
Updated
THE SHORT ANSWER
Most trips are spread through the day.
Journeys to and from work are not.
PEAKS
DfT data shows commuting is concentrated into a morning peak of 07:00 to 09:00 and an evening peak of 16:00 to 19:00.
Compare commutesCARS
Outside London, 70% of commuting trips by people in urban areas were made by car in 2023, rising to 81% for people in rural areas.
See the numbersRELIABILITY
Commuters who walk or cycle reported the most reliable journey times, followed by rail. Drivers reported the most day-to-day variation.
Ways to ease itA QUICK COMMUTE CHECK
Pick a way of getting to work to see the average commuting trip time in Great Britain. The bar shows how long that trip takes compared with the others.
National Travel Survey figures for 2009, the latest by-mode commute times in the DfT factsheet read for this page.
TWO NUMBERS WORTH KNOWING
One figure on the timing of the morning rush,
one on how much commuting has changed.
07:51
Average start of a trip to work, 2013/14
Journeys to work started a few minutes earlier than in 1988/92 (07:55), while trips home started later, at 16:23 instead of 16:03: a longer day at work.
START TIME · DfT 2017
≈ −20%
Change in commuting trips per person
In 2025 men made 129 commuting trips each on average, 20% fewer than in 2019, and women 96, 19% fewer. Commuting was 13% of all trips.
SINCE 2019 · NTS 2025
The 2025 survey moved to a digital travel diary, which DfT says is linked to lower recorded rates for some trip types, so year-on-year comparisons need care.
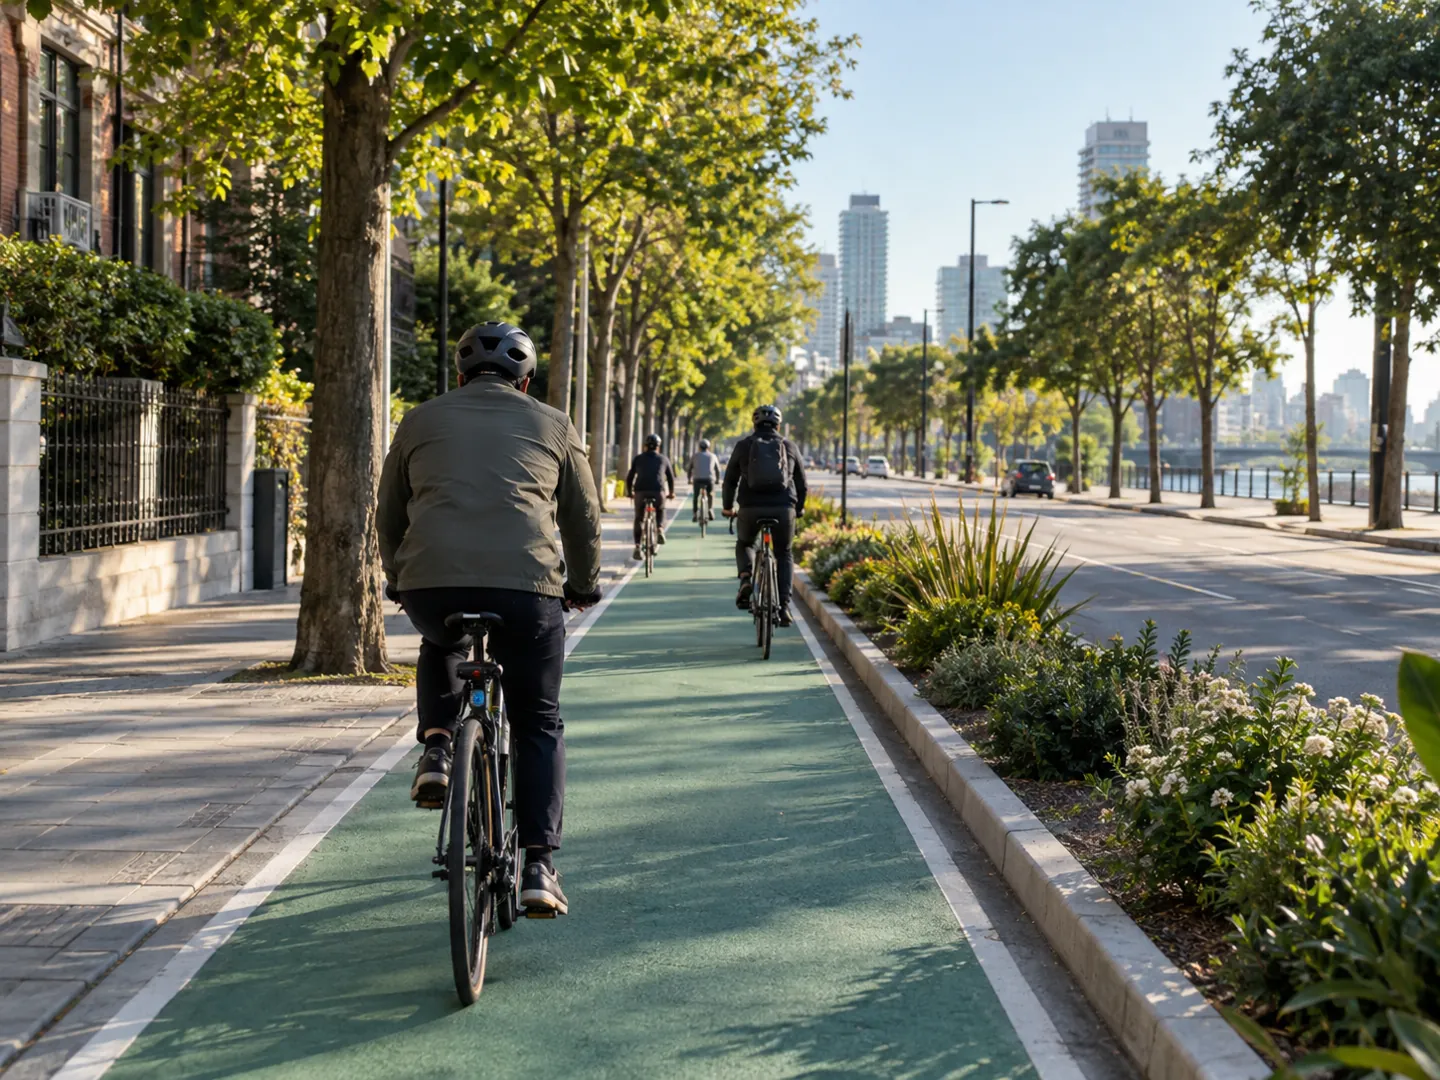
FOUR WAYS TO DODGE THE RUSH
These follow from when the peaks happen and which kinds of trips are most reliable.
Commuting is heaviest from 07:00 to 09:00 and 16:00 to 19:00. Even starting a little earlier or later avoids the busiest window.
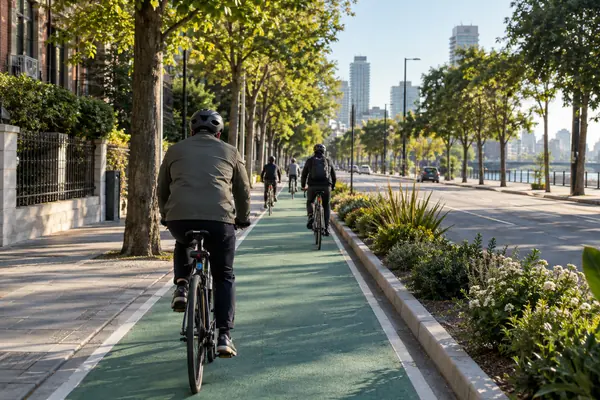
Walkers and cyclists report the most reliable journey times of any commuters.
Working from home is growing, and commuting trips per person in 2025 were about a fifth below 2019.
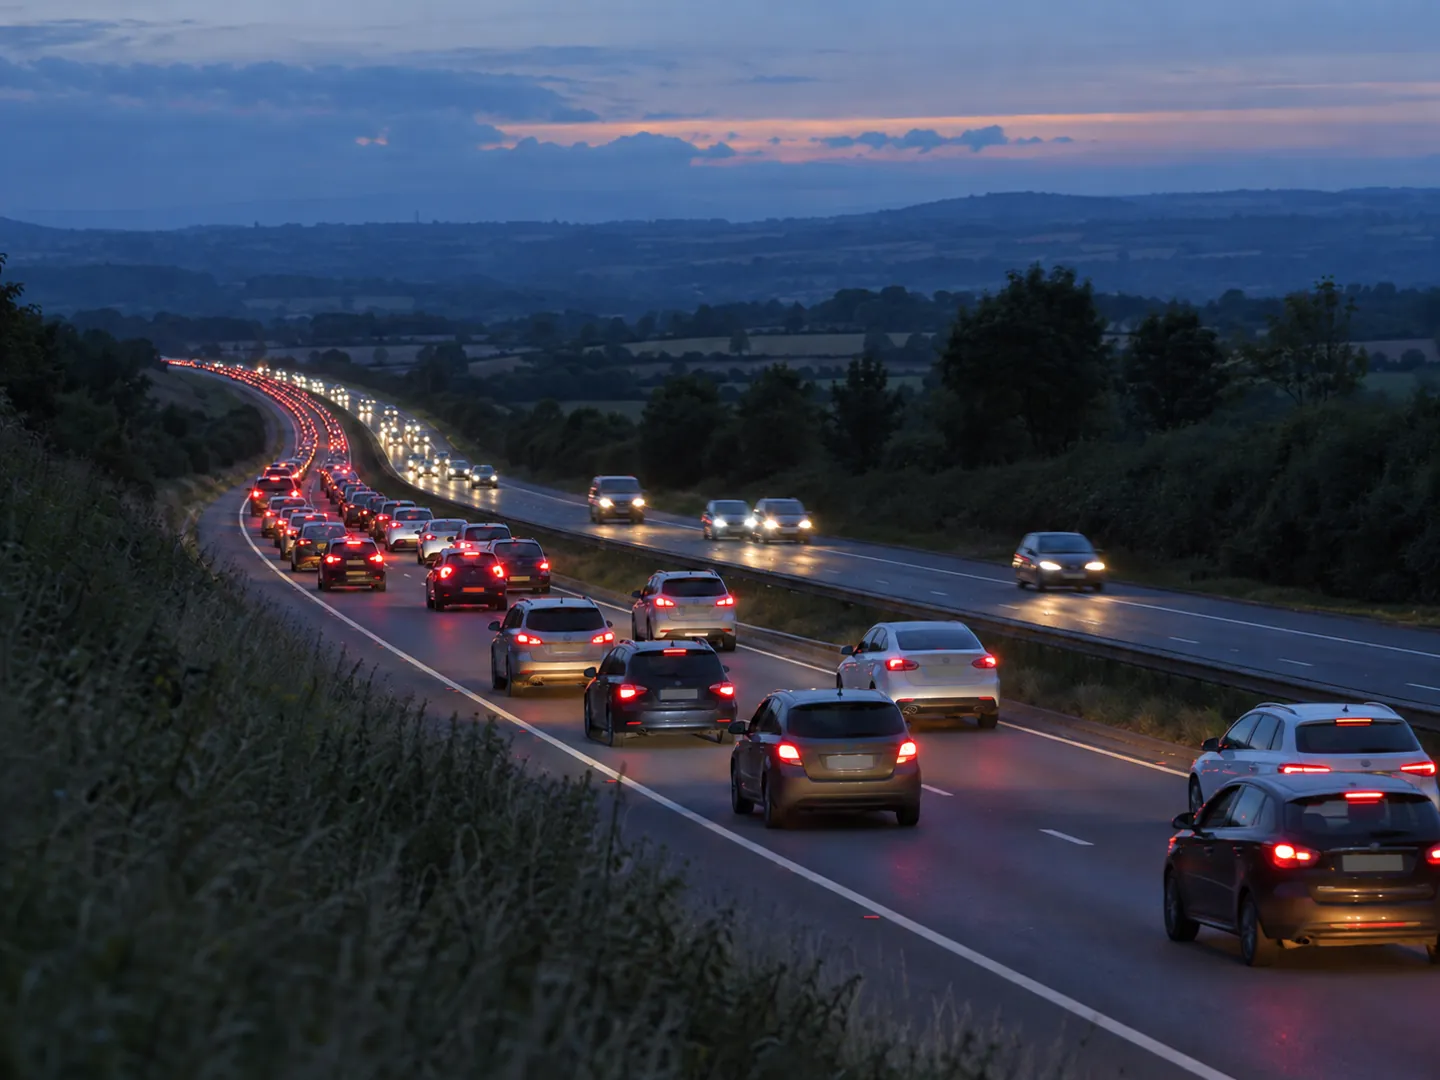
Drivers report the most day-to-day variation in commute time, and say congestion and roadworks are their biggest problem.
WHY THE RUSH IS SO INTENSE
In the DfT's 2017 study, commuting was only 16% of personal journeys in England but a fifth of all miles travelled, because trips to work are much longer than most others. And they all happen at the times the network is busiest.
In 2023, commuting was the second most common trip purpose after shopping, at 117 trips per person, and accounted for the longest distance of any purpose, at 1,055 miles per person a year.
Questions
DfT data shows commuting is concentrated into a morning peak from 07:00 to 09:00 and an evening peak from 16:00 to 19:00 on weekdays.
The DfT's 2011 factsheet put the average journey to work at 28 minutes in 2009, and just over 41 minutes for London residents.
Yes, per person. In 2025, men made 20% fewer and women 19% fewer commuting trips than in 2019, though a new digital diary may have lowered some recorded trip rates.
Walkers and cyclists report the most reliable journey times, followed by rail commuters. Drivers report the most variation from day to day.
Commutes are long trips squeezed into short windows. In the 2017 DfT study they were 16% of journeys but 20% of miles travelled.
ABOUT THIS NAME
doodlerush.com is part of the DoodleSale portfolio. It isn't in an auction right now, but you can ask about leasing it.